
The fundamental factors behind the Brexit vote
Thiemo Fetzer Dennis Novy Sascha O. Becker
In the Brexit referendum on 23 June 2016, the British electorate voted to leave the EU. The vote is widely seen as a watershed moment in British history and European integration. This column asks why some areas vote to leave the EU, and others voted to remain.
The UK referendum on EU membership on 23 June 2016 is a key moment for European (dis)integration. Even though the outcome had been expected to be tight, in the days running up to the referendum bookmakers and pollsters predicted the ‘Remain’ side to win. Many observers were left puzzled and keen to understand who voted for ‘Leave’. Various newspapers and blogs quickly reported plots that relate the referendum vote to key characteristics such as the age profile of the population (Burn-Murdoch 2016). It was also pointed out that the Brexit vote relates to class identification and social attitudes more generally (Kaufmann 2016).
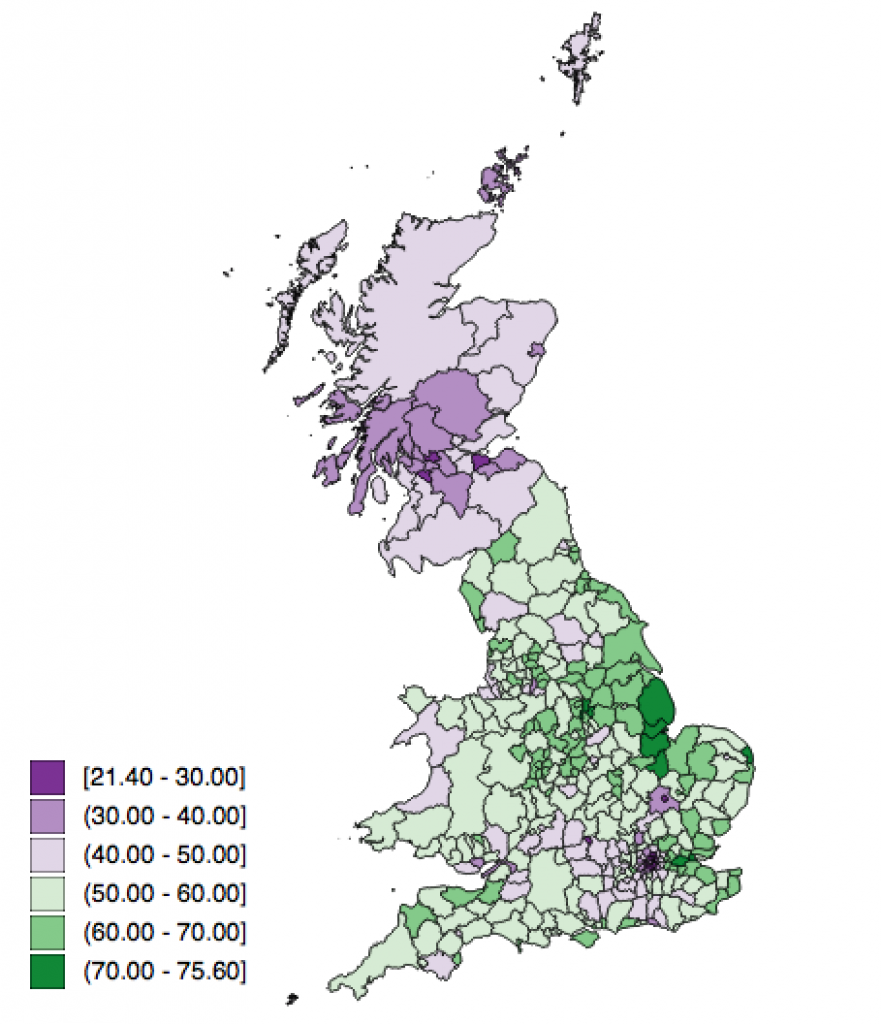
In a new paper, we follow these early contributions and analyse the Brexit referendum vote in more detail (Becker et al. 2016). We study the EU referendum result in England, Wales and Scotland in a disaggregated way across 380 local authorities (and across 107 wards in four English cities). We relate the vote to fundamental socio-economic features of these areas. Figure 1 plots the Leave vote shares across the local authority areas (excluding Northern Ireland and Gibraltar).
Figure 1 Map of the Leave share (in percent) across local authority areas in the 2016 EU referendum.
We adopt a simple machine-learning method to capture different subsets of socio-economic variables that best ‘predict’ the actual referendum result. We cannot possibly give a causal explanation of the referendum result because the election outcome is obviously multi-causal and multi-faceted. In other words, our results reflect a broad range of correlation patterns. Nevertheless, our systematic analysis across an exhaustive range of socio-economic characteristics can be helpful to direct future research efforts that aim at identifying specific causal mechanisms.
UKIP and Brexit support are tightly linked
Our results indicate that electoral preferences as measured by the 2014 European Parliamentary elections explain almost 92% of the variation in the support for Leave across local authority areas. As Figure 2 shows, the UKIP vote share is particularly important.
Figure 2 UKIP vote shares (in percent) across local authority areas in the 2014 European Parliament elections plotted against the Leave shares in the 2016 EU referendum.
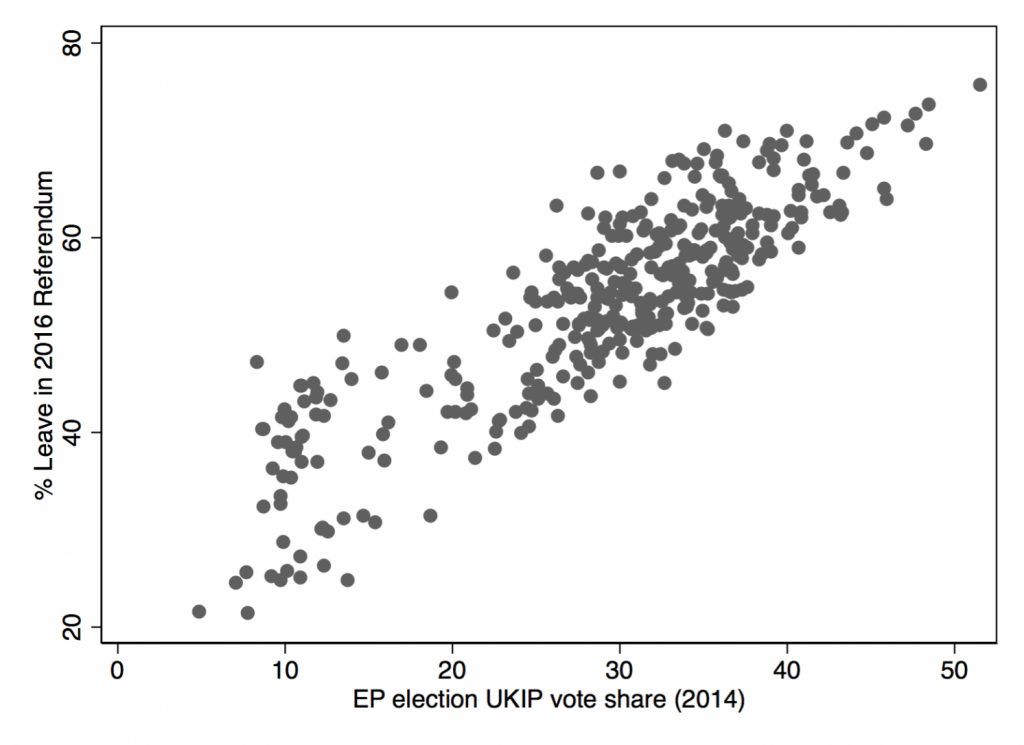
Understanding the UKIP vote share therefore seems crucial for understanding the Brexit vote. Only founded in 1991 and taking on its current name in 1993, UKIP is a fairly new contestant on the British political scene. It has traditionally been seen as pushing the single issue of Britain leaving the EU. In the 2014 European Parliament elections it won the largest vote share, beating the Labour Party and the Conservative Party into second and third place. UKIP therefore has the ability to mobilise a large number of voters. But due to Britain’s first-past-the-post voting system UKIP is otherwise hardly represented in national UK politics. UKIP only has one Member of Parliament in the House of Commons and three representatives in the House of Lords. Understanding the drivers behind UKIP’s ascent in recent years thus seems important (Ford and Goodwin 2014).
Socio-economic characteristics
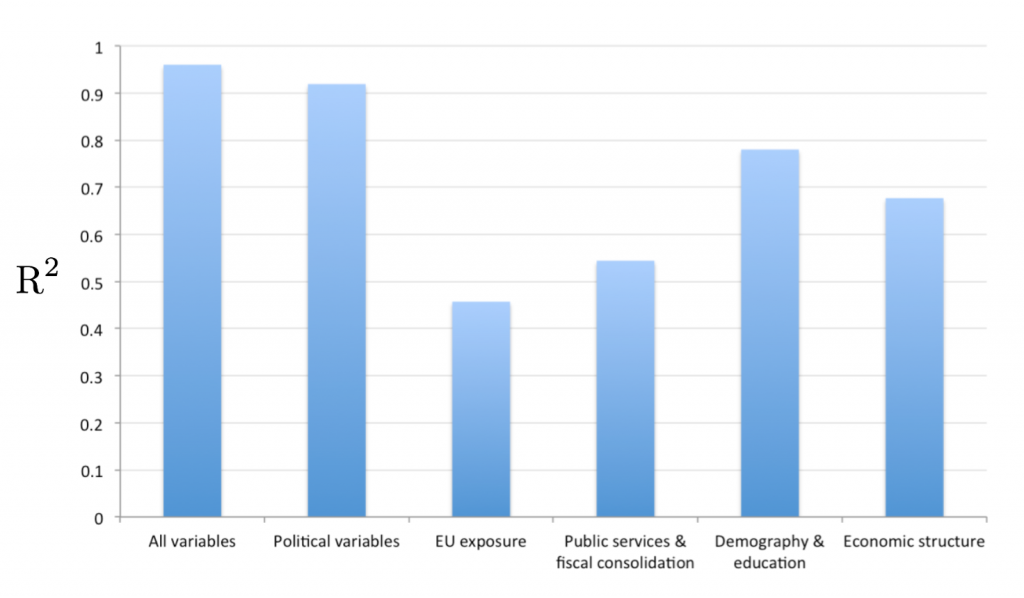
Figure 3 reports the goodness of fit in regressions that use different sets of explanatory variables. This helps to shed light on the relative explanatory power of different salient ‘issues’. For example, we find that demography and education (i.e. the age and qualification profile of the population across voting areas) explain just under 80% of the Leave vote share. The economic structure explains just under 70%. Variables in this group include the employment share of manufacturing, unemployment and wages.
Figure 3 Goodness of fit (measured as R-squared) in separate regressions explaining the Leave vote share at the local authority area level using only regressors from the respective group of variables.
EU exposure and immigration
Surprisingly, and contrary to much of the political debate in the run-up to the election, we find that relatively little variation (under 50%) in the Leave vote share can be explained by measures of a local authority area’s exposure to the EU. These measures include a local authority’s trade exposure to the EU (albeit measured at a coarser spatial resolution), its receipts of EU structural funds, and importantly, the extent of immigration. We find evidence that the growth rate of immigrants from the 12 EU accession countries that joined the EU in 2004 and 2007 is linked to the Leave vote share. This stands in contrast to migrant growth from the EU 15 countries or elsewhere in the world. It suggests that migration from predominantly Eastern European countries has had an effect on voters. However, we cannot identify the precise mechanism – whether the effect on voters is mainly economic through competition in the labour and housing markets, or rather in terms of changing social conditions. Becker and Fetzer (2016) provide a first attempt to study the causal impact of migration on the evolution of anti-EU voter preferences, which in turn correlate with support for Leave. Using a difference-in-difference setup, they find – consistent with the present paper – a relatively modest but statistically significant association between immigration from Eastern Europe and growing anti-EU sentiment proxied by support for UKIP across European Parliament elections between 1999 and 2014.
Fiscal consolidation
In the wake of the Global Crisis, the UK coalition government brought in wide-ranging austerity measures to reduce government spending and the fiscal deficit. At the level of local authorities, spending per person fell by 23.4% in real terms, on average, from 2009/10 until 2014/15. But the extent of total fiscal cuts varied dramatically across local authorities, ranging from 46.3% to 6.2% (Innes and Tetlow 2015). It is important to note though that fiscal cuts were mainly implemented as de-facto proportionate reductions in grants across all local authorities. This setup implies that reliance on central government grants is a proxy variable for deprivation, with the poorest local authorities being more likely to be hit by the cuts. This makes it impossible in the cross-section (and challenging in a panel) to distinguish the effects of poor fundamentals from the effects of fiscal cuts. With this caveat on the interpretation in mind, our results suggest that local authorities experiencing more fiscal cuts were more likely to vote in favour of leaving the EU. Given the nexus between fiscal cuts and local deprivation, we think that this pattern largely reflects pre-existing deprivation.
Short-run factors: Rainfall and train cancellations
We also explore the role of some short-run factors such as heavy rainfall and flooding on the referendum day as well as train cancellations in the South East of England. While we document that these did have a reducing effect on turnout, the reduction does not seem to have affected the overall result – the Remain campaign would still have lost on a sunny day.
Which factors explain more of the variation in the Leave vote share?
Demography, education and economic structure, i.e. fundamental, slow-moving factors explain more of the variation in the Leave vote share than measures of EU exposure, fiscal consolidation and public services which are arguably comparatively easier to influence.
We further study the role of fundamental factors by looking at ward-level referendum results within four English cities (Birmingham, Bristol, Nottingham and Greenwich/London). We find that indices of deprivation, available at the highly disaggregated level of wards, correlate with the Leave vote share within cities. These fundamentals seem to have received less attention in the media than they should have.
First past the post and lack of democratic representation
Our results are consistent with the notion that the voting outcome of the referendum was largely driven by long-standing fundamental determinants, most importantly those that make it harder to deal with the challenges of economic and social change. These fundamentals include a population that is older, less educated and confronted with below-average public services. We therefore doubt that a different style of short-run campaigning would have made a meaningful difference to vote shares. Instead, a more complex picture arises about the challenges of adapting to social and economic change.
It is clear that a majority of politicians and the media were caught off guard by the referendum result. This suggests that the needs of under-privileged areas of the country may be under-represented in the political decision process and the corresponding media attention. This is sometimes referred to as the ‘Westminster bubble’. In fact, as a result of the first-past-the-post voting system, a mismatch arises. Despite strong electoral support in European Parliament elections, which follow a proportional voting system, UKIP currently only has one Member of Parliament in the House of Commons out of over 600. It may be appropriate to consider ways of introducing more proportional representation into British politics to allow more diverse views to be represented in Parliament and to subject them to public scrutiny in the parliamentary debate.
Your content goes here. Edit or remove this text inline or in the module Content settings. You can also style every aspect of this content in the module Design settings and even apply custom CSS to this text in the module Advanced settings.
Becker, S O, F Fetzer and D Novy (2016), “Who Voted for Brexit? A Comprehensive District-Level Analysis”, CAGE Working Paper 305, October.
Becker, S O and F Fetzer (2016), “Does Migration Cause Extreme Voting”, CAGE Working Paper 306, October.
Burn-Murdoch, J (2016), “Brexit: Voter Turnout by Age”, Financial Times, 24 June.
Ford, R and M Goodwin (2014), Revolt on the Right: Explaining Support for the Radical Right in Britain, Abingdon, UK: Routledge.
Innes, D and G Tetlow (2015), “Delivering Fiscal Squeeze by Cutting Local Government Spending”, Fiscal Studies 36(3), 303–325.
Kaufmann, E (2016), “It’s NOT the Economy, Stupid: Brexit as a Story of Personal Values”, British Politics and Policy Blog, London School of Economics and Political Science, July.
Who voted for Brexit? Individual and regional data combined, Economic Policy, Volume 32, Issue 92, October 2017, Pages 601–650.
🔓 Open access
🗃️ Replication archive
On 23 June 2016, the British electorate voted to leave the European Union (EU). We analyse vote and turnout shares across 380 local authority areas in the United Kingdom. We find that exposure to the EU in terms of immigration and trade provides relatively little explanatory power for the referendum vote. Instead, we find that fundamental characteristics of the voting population were key drivers of the Vote Leave share, in particular their education profiles, their historical dependence on manufacturing employment as well as low income and high unemployment. At the much finer level of wards within cities, we find that areas with deprivation in terms of education, income and employment were more likely to vote Leave. Our results indicate that a higher turnout of younger voters, who were more likely to vote Remain, would not have overturned the referendum result. We also compare our UK results to voting patterns for the far-right leader Marine Le Pen in the 2017 French presidential election. We find similar factors driving the French vote. An out-of-sample prediction of the French vote using UK estimates performs reasonably well.
Press Coverage & Non-Technical Summaries
2016
El Diario (Spain) 🇪🇸, Indy 100 (UK) 🇬🇧, The Guardian (UK) 🇬🇧.
2017
Le Monde (France) 🇫🇷, Modkraft (Denmark) 🇩🇰, The Canary (UK) 🇬🇧.
2018
Folha de S.Paulo (Brazil) 🇧🇷.
2019
New York Times (US) 🇺🇸, The Economist (UK) 🇬🇧.
Non-technical summary
2016
LSE Politics (UK) 🇬🇧, VoxEU (UK) 🇬🇧.
Social Media Summary
Today is the 5th year anniversary of the 2016 EU referendum vote in which the UK had narrowly voted to #Leave the European Union. Unlike Trump, the impact is permanent and already caused notable damage. Here is a 🧵 of 🧵 with some past work and deliberations on #Brexit… 1/… pic.twitter.com/t29wmf17pQ
— Thiemo Fetzer 🇪🇺🇺🇦 – same handle elsewhere (@fetzert) June 23, 2021