Our work on production networks, the AIPNET, is in my view really important in so many dimensions that I can not stress more and more in conversations with shapers. It also highlights the centrality of some goods in production networks. It also highlights the relevance of certain sectors, owing to their product complexity, to supply chain disruptions. And it can help identify pivot opportunities, implying It may also help think about how to reconfigure our global trading system to focus on resilience and the net zero transition.
As I am working on finding ways to visualize the myriad of insights we shared in the AIPNET paper, I come to appreciate more and more what is already known. The US specialization in hydrocarbons, the Chinese specialization in critical minerals. This has had the unfortunate consequence or implication that the US/China contest, with Europe uncomfortably squeezed in between, has implied that climate action has been thrown into the geopolitical contest dimension. Bill Gates recent suggestion that the world has to accept global warming or climate change seems to be right in this ballpark.
Elon Musk’s DOGE, which de-facto undermined US soft power abroad through the gutting of USAID is gifting China a soft power opportunity. This is despite the fact that the US is projecting its power advantage and the Greenback in the global south through its digital rails and fintech innovation (aka: stablecoins). This would leave China to make inroads on the much needed global climate action and could render some projects in the global south as win-win opportunities.
Through all of this, we should not lose sight of the fact how our current production paradigm looks like. In the AIPNET paper, we introduce a new way to think about criticality. There are many approaches, but in essence the IGPC aims to combine measures of supply- and demand concentration, network centrality as covered by the AIPNET adjacency matrix and the global trade share that captures the importance of a specific good or service as a share of global trade in terms of value.
In the paper, we present this graph. This to me highlights the geopolitical contest and its build up in a single graph. I will explain what is going on under the hood. But for China, there is a clear upward trend in IGPC centrality over time, reflecting rising systemic importance in critical intermediate inputs and vertically integrated clusters. The measure captures China’s expansion across upstream components (e.g., machinery, electronics, EV supply chains, critical minerals). It highlights how China has become the manufacturing hub of the world, that has increasingly absorbed and focused on critical materials, minerals and energy.
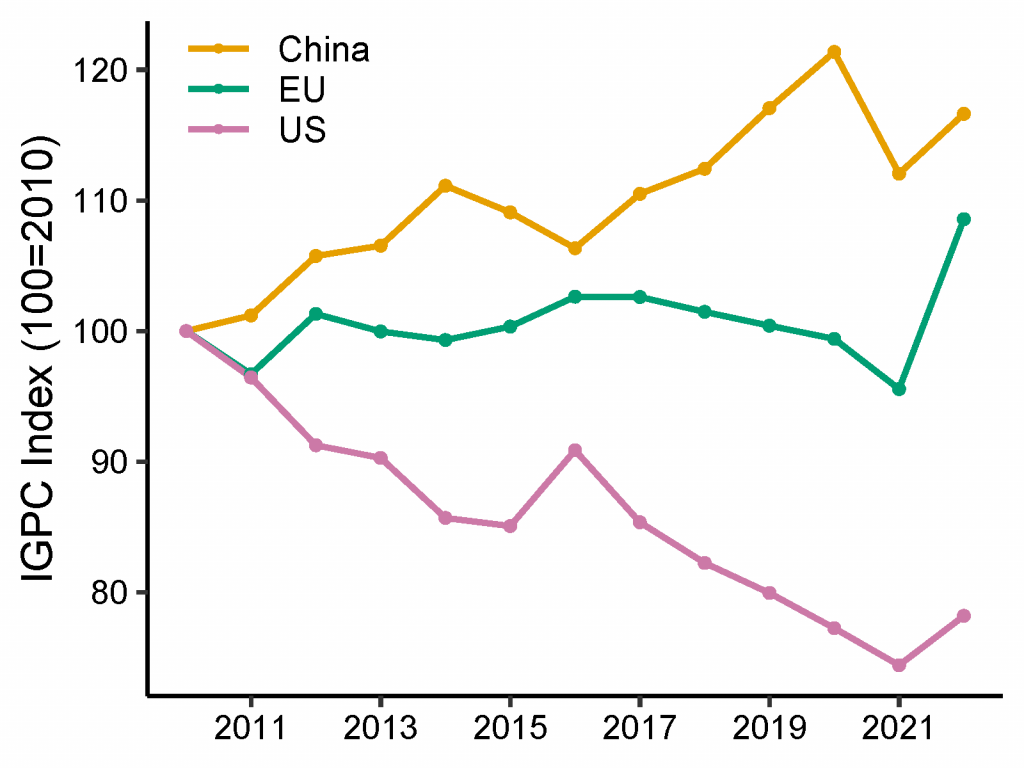
For the United States, we see a continuous decline in centrality. The US has disengaged from some parts of international trade. This is most salient for commodities in particular, hydrocarbons. The US has become self-sufficient in oil and gas and on the latter wants to become a major exporter. I have studied shale oil and gas and the implications for US economic geography. The declining import reliance of the US in this domain has a knock on effect of countries increasingly questioning whether and why the commodity should be traded in US dollars as part of the “attack” on the global currency system which the US is presently aiming to counter via stablecoins.
Europe is sitting right in between being quite well hedged or ready to be torn apart in a grand bargain between China and the US. Europe has benefited from both the Chinese ascent as well as the United States as a demand node in the global production system for physical goods. This is being challenged as part of the geopolitical context. To make more visible what is going on “under the hood”, we are working on new improved visuals.
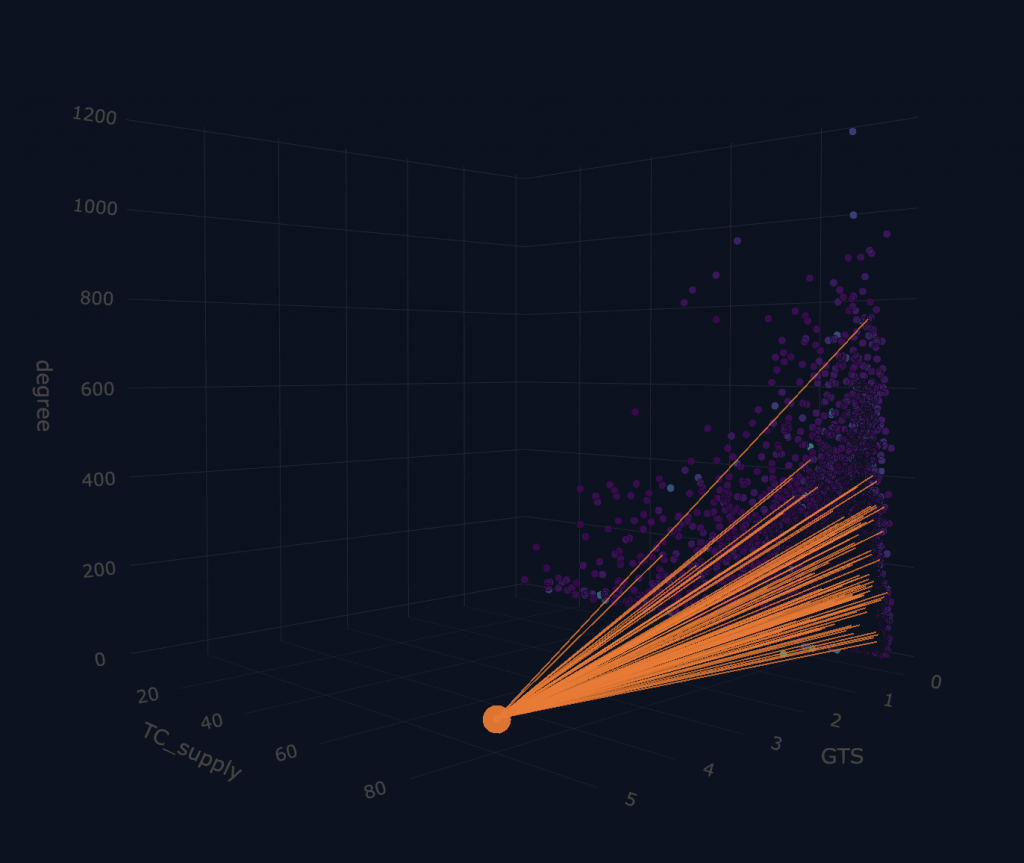
These are naturally “difficult” to do as humans, well, struggle with more than 3-dimensional state spaces. But it nevertheless is useful. The IGPC index is a combination of demand/supply concentration (think of it as producer versus consumer power, monopoly/monopsony power). The network centrality is capturing the importance of a specific good as an input factor, and the global trade share captures the importance of a specific good or service to international trade and hence the financialisation of international trade around that good more generally.
If we span a three dimensional graph in these dimensions. The node highlighted here is petroleum oils/minerals. It highlights what we may suspect or expect: crude oil has a high degree of supply concentration, it makes up a big chunk of global trade, and is itself a modest amount of out-degrees but there are tons of indirect and onward uses. In some ways we can think about hydrocarbons spanning the production network or the modern economy more broadly.
And again, there is nothing surprising here because, well, energy is a key factor of production and a key driver of prosperity of nations.
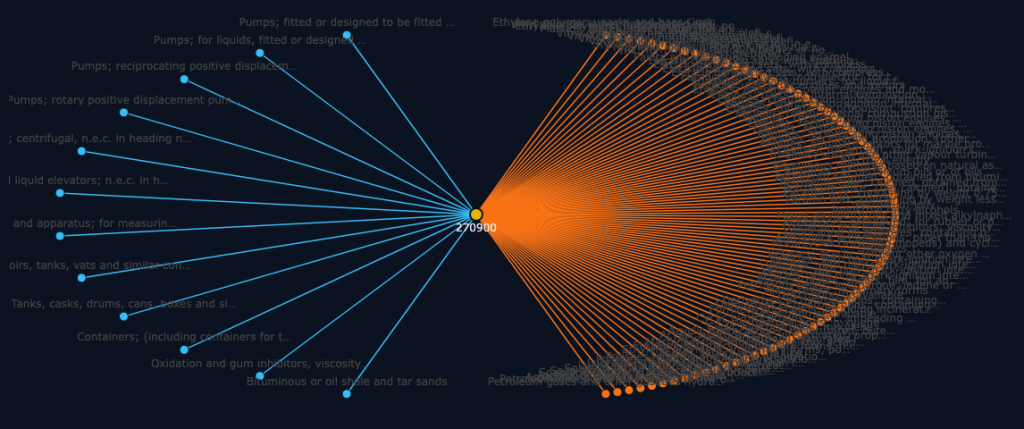
This is what explains a big chunk of the US trend in the figure across countries. The US has become increasingly self-sufficient in crude oil and gas, this leads to a decline in its IGPC index, as it is less importing raw materials that have many onward uses. The centrality of crude becomes very clearly visible when we look at the plot that highlights the outdegree nodes.
Here you see in essence the input- and the output nodes separated visually. It highlights how crude is an input to many goods that are internationally traded that make part of our modern economies.
Now, what about China?
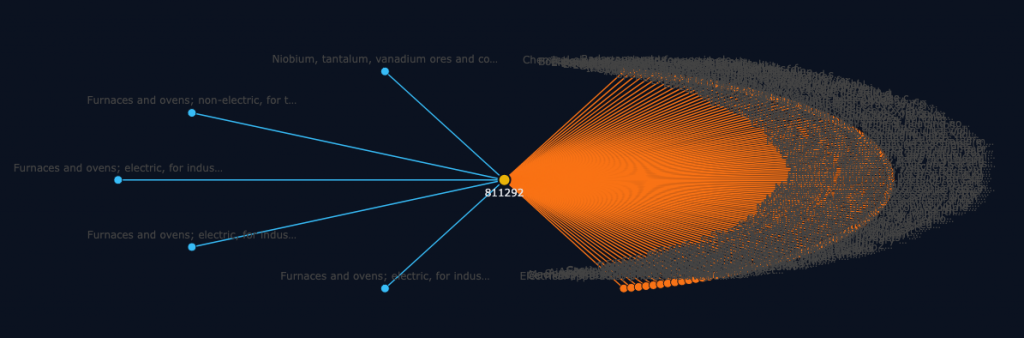
We can do a similar visualization for the case of rare earths, for example, considering Gallium, Germanium etc. This is the case of the famous rare earths that China has, over decades, built leverage and control over through the deployment of industrial policy; what some call a creative approach to WTO membership and the potential deployment of strategic reserves to undermine private sector led rare earth refinement sector development. You see that in this canvas or visual, Gallium is quite central, but it has a tiny share of the amount of global trade. But, it is essentially Leontieff in the production process — incredibly hard to substitute (we are working on measuring this better), and it is very much important in many production processes as an input that is hard to replace
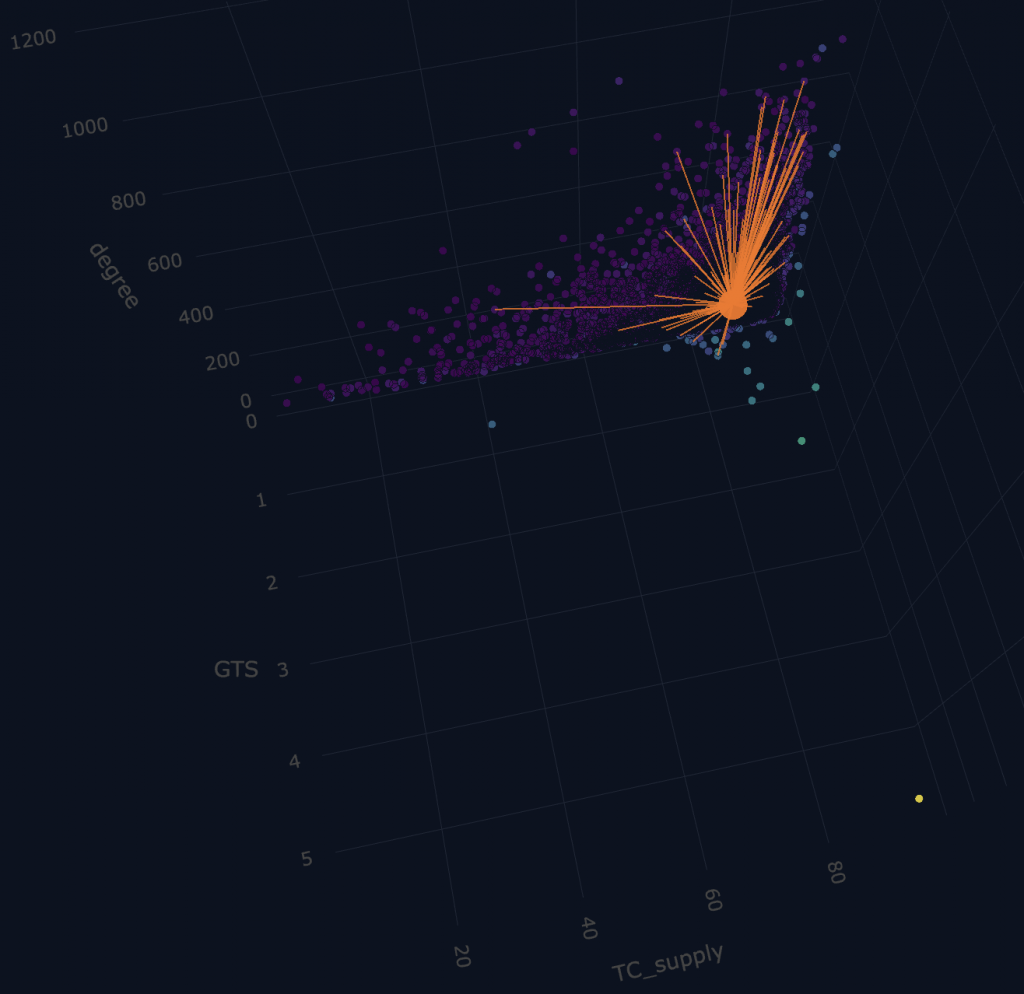
For reference, this figure included the crude oil as an example, but to illustrate this more sharply, consider the simple plot of input- and output linkages. You see how this looks not too dissimilar from crude oil in terms of the topology. Many outdegree links, few in-degree links. This is what makes the rare earth mineral stand out. And, unlike crude oil or natural gas, which can be replaced in many chemical processes, replacing rare earths is difficult.
This explains why the US and Europe is on the back foot. And of course, it should be said China has built this advantage over many decades in plain sight. The first time I studied this was when my friend and former PhD colleague Jason Garred had highlighted how China effectively maintained the benefits from being outside of the WTO while being on the inside through the use of export taxes.
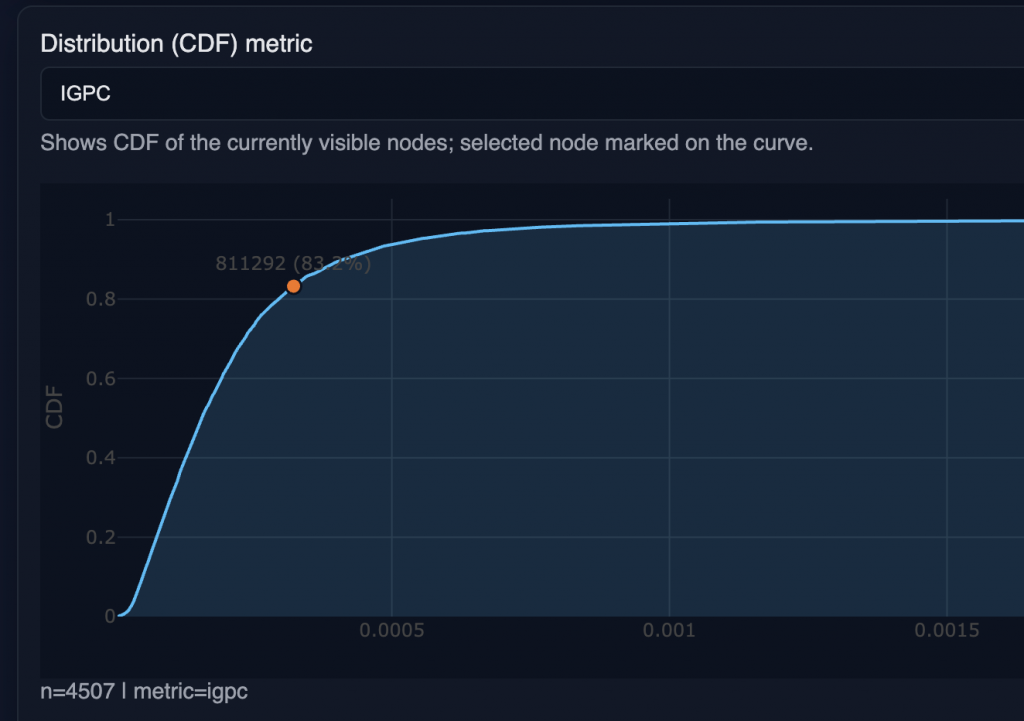
And you see how the case of Gallium produces a centrality score that is at the top end of the distribution. Not quite the level of crude oil in our production system, but not far from the top. And in light of the lack of substitutes to rare earths, it highlights how climate action has, unfortunately, now become a part of the geopolitical contest between China and the US.
China effectively has specialized in building strategic control over minerals that are crucial to climate action: think solar panels, wind power etc., which each use rare earths as inputs. They also build control over many rare minerals that are part of the semiconductor supply chain.
We hope to share some of these visuals in a much more accessible format in not too long to help bring this knowledge to a broader audience.